 Tanvir
- Sole UI/UX Designer
- Dashboard · Security Center · Quotes · Claims · Chart widgets · Design system
- 2 min
01/The project
Cyber insurance that shows its working
Safemargins is a cyber insurance platform from DTS Solutions. A company's cover, and what it pays at renewal, depends on how exposed it looks: what external scans find on its servers and domains, how its security questionnaires read, and how it compares with similar companies.
The person signing in is usually an IT or security lead with a short list of questions. Are we OK for renewal? What should we fix first? Is our cover enough? What happens if something goes wrong? I designed each page around one of them, so it's answered by a number or a chart before anything else.
I was the only designer on it, and the MVP has shipped. The work is under NDA, so this page shows a selection of it, with sample data in place of real customers.
- Cyber insurance platform
- Web app
- Dashboard, charts and design system
02/At a glance
Where a policyholder starts
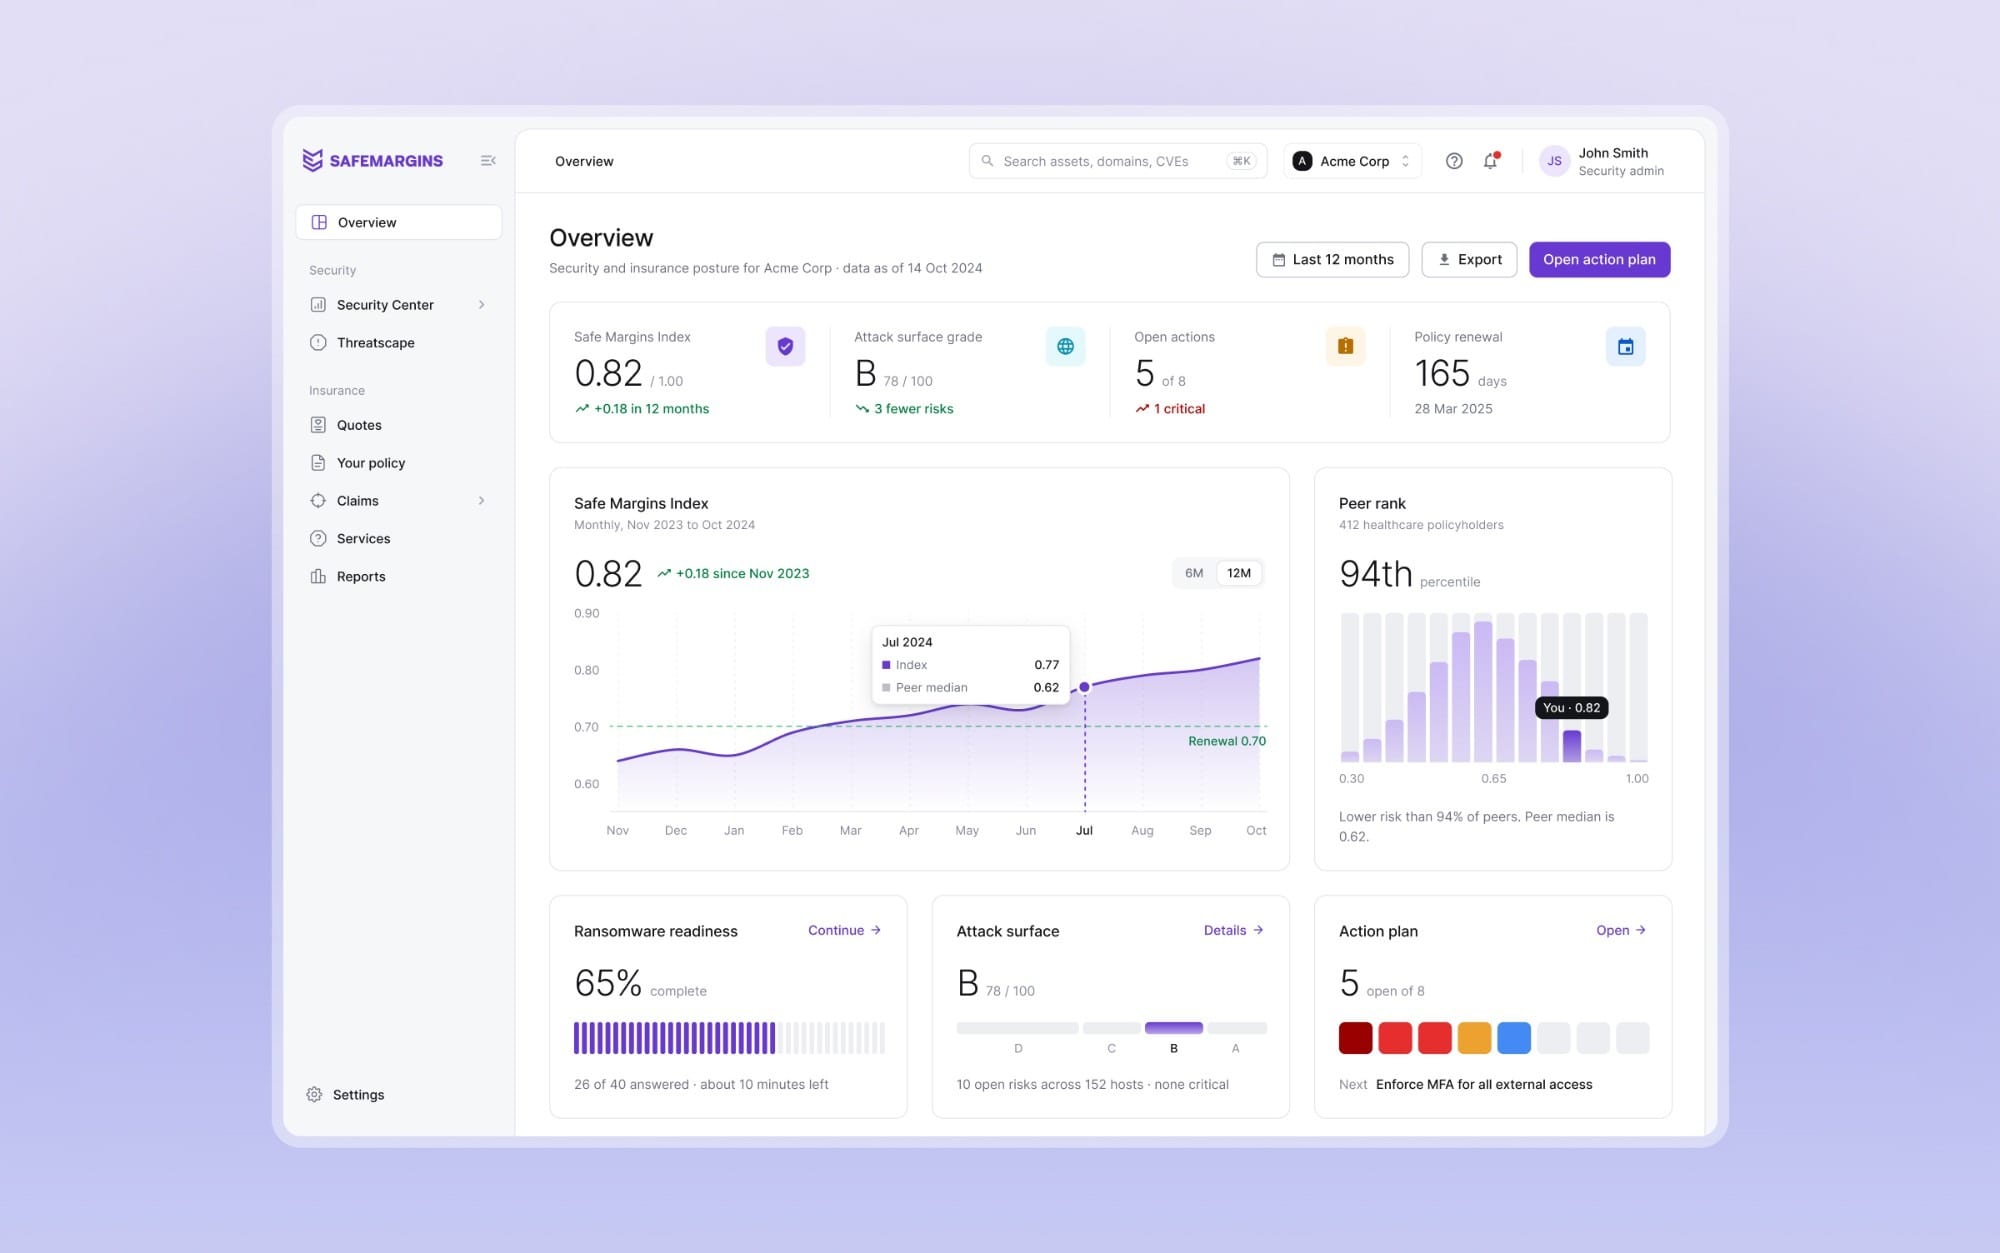
The overview reads top to bottom: four numbers, the index over time, peer rank, then what to do next and what's coming up.
03/Renewal
Am I OK for renewal?
The first question is about money. Renewal pricing follows the Safe Margins Index, a score from 0 to 1 built from scans and questionnaires, so the number had to make sense at a glance.
- A score needs something to judge it by. The 0.70 renewal threshold is drawn on the trend, so being above it is visible before you read anything.
- 0.82 means little without other companies. Peer rank shows the whole spread of 412 healthcare policyholders, the median, and where you sit.
- Getting ready for renewal touches several pages. Readiness, grade, the action plan and the policy year each get a small card with one measure that fills.
04/Fix first
What should we fix first?
Next comes what to fix. Scans find a lot, so the few things that actually move the index come first, and each fix has a clear end.
- A list of risks doesn't say which matter. Risks are grouped by severity, and recommendations are ranked by how much each one lifts the index.
- Knowing what to fix isn't knowing how. Each recommendation opens with why it matters, the evidence, the steps, and a vendor that can help.
- Resolving something should feel finished. Marking it resolved moves it to the resolved list and says when the index will update.
05/Cover
Is our cover enough?
This is where security and insurance meet. A policy limit only means something next to what an incident could cost, so these charts put the two side by side.
- A $1M limit is abstract. The loss curve marks the limit, and everything above it, the part the company would pay itself, shows in amber.
- Quotes compared on price alone mislead. Premiums are shown per $1M of cover on one scale, with today's policy as the reference.
- Not every kind of loss is covered the same. Exposure against insurance splits first and third party, financial and tangible, so the gap has an address.
06/Claims
When something goes wrong
Someone filing a claim may be in the middle of an incident. So the form tells them what to do right now before it asks for anything, and submitting it says exactly what happens next.
- Mid-incident, a form comes second. First steps and the response line sit beside the form, and saying the incident is ongoing brings up the hotline.
- After sending, people need to know what's next. The confirmation gives a reference and the steps over the next day, starting with when a claims lead will call.
07/Widgets
Risk in dollars
The risk quantification and assessment reports put risk in dollars. I designed their chart widgets as components with resting and hover states, on the app's own colours and type. Here are three.
- Probability curves are hard to read. Each curve is labelled at its peak, and the hover answers one plain question, like the chance of losing more than $2M.
- A comparison is only honest on one scale. The company and the industry benchmark always share an axis.
08/Looking back
Start from the question
The decision that shaped everything was starting from the questions a policyholder brings, not from the data the platform holds. Scans, questionnaires and policy records produce far more than anyone needs to see, so each page answers its question first, with the detail one click away.
The company, people, prices and claims shown here are sample data I wrote so the numbers tie out.